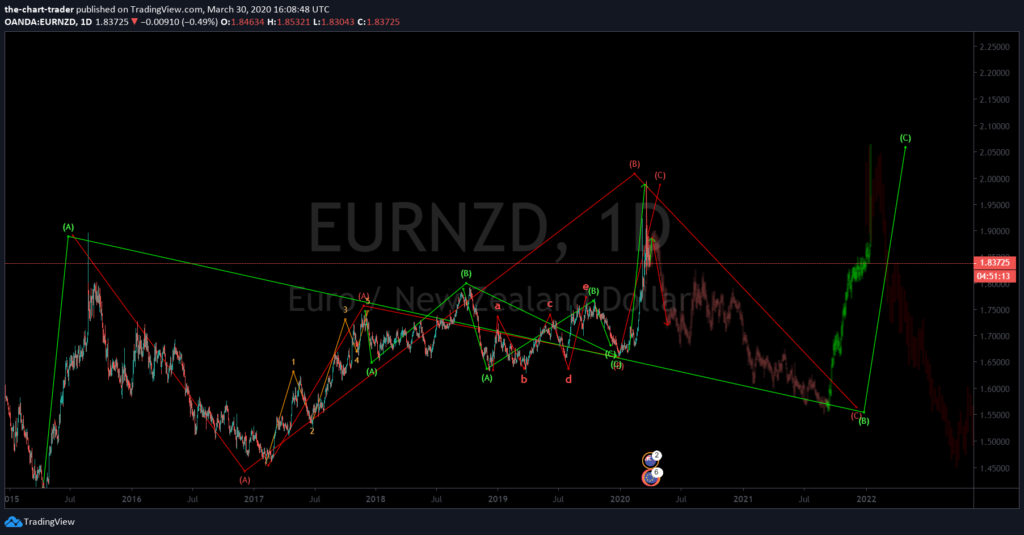
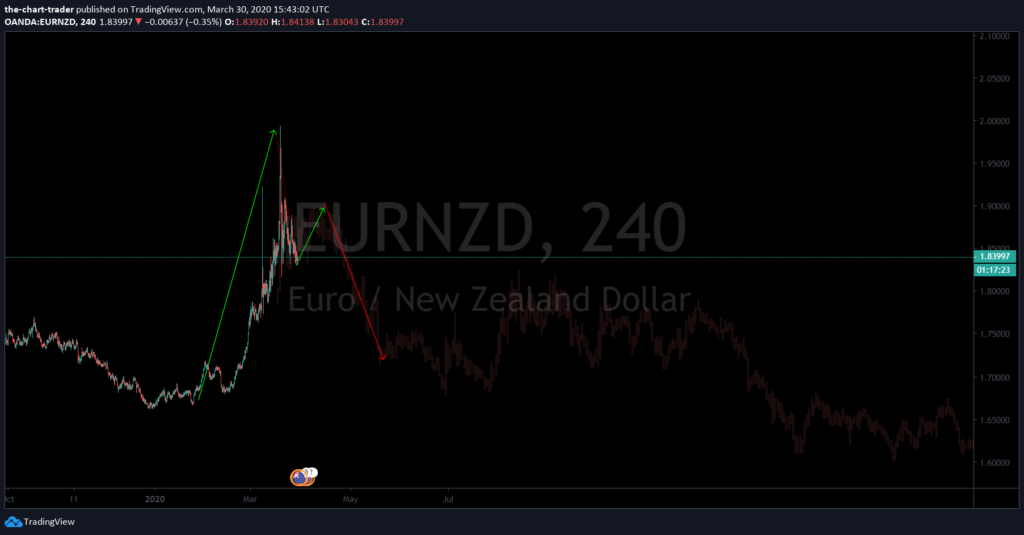
EURNZD, Forecast
We expecting a big move to the down side, to kick in asap, we see wave 1 has completed, and now we are in the making of wave 2, we anticipating the wave 3 to kick-in sometime soon after reaching our key level as showed on the chart
Click on the chart below to view in full screen
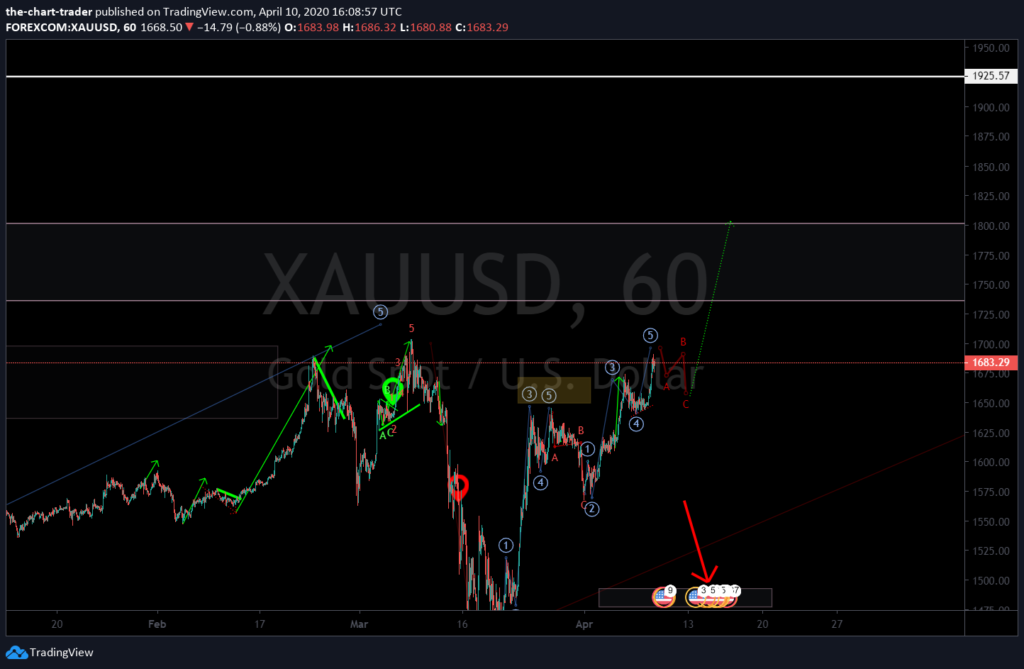
Elliot waves analysis on gold 10/04/2020 
Sentiment
The Sentiment displays current percentages of long (buy) and short (sell) positions in the transaction flow.
The resulting market sentiment is defined as the difference between the two, with red negative readings signalling “sell” sentiment, and green positive ones indicating “buy” sentiment.
The data is updated every 30 minutes.
The available instruments include various currency pairs and commodity, stock and index CFDs. Additionally, the widget offers aggregated information for numerous currencies. This is the REAL Sentiment from the liquidity provider and the liquidity consumer.
Historical Sentiment
The table in the Historical Sentiment shows whether long (buy) positions dominate over short (sell) positions in trading of various Forex instruments. The displayed numbers are the differences between the percentages of long and short positions in the transaction flow, with red negative readings signalling “sell” sentiment, and green positive ones – “buy” sentiment. The data is updated every 30 minutes.
Note that the sentiment is measured separately for liquidity consumers and liquidity providers.
CoT Charts
The Commitments of Traders (CoT) offers clear graphical representation of the weekly CoT reports published by the Commodity Futures Trading Commission (CFTC). These reports show the number of contracts comprising total long and short positions of the traders in the futures market. The data is usually released at 19:30 GMT summer / 20:30 GMT winter time on Fridays, and depicts the positioning at the previous Tuesday’s open.
The chart based on the currency futures reports and shows the long, short, and net positions of non-commercial traders, such as asset managers, hedge funds, and derivatives dealers.
As the secondary currency in these futures is the US Dollar, the labels used in the CoT Charts only show the base currency. Thus, for example, the chart for EUR depicts the data for EUR/USD futures. The instruments available, include the Euro (EUR), the Pound (GBP), the Yen (JPY), the Swiss Franc (CHF), and the Canadian (CAD), the Australian (AUD) and the New Zealand (NZD) Dollars.
The CoT Charts provide valuable insight for the Forex traders, as they help to:
• identify trends through flips in the overall positioning,
• determine the strength of trends through changes in aggregate number of contracts, and
• recognise market reversals though extreme positioning.
Watch the market outlook for this week
Watch our before & after market forecast
Disclaimer, The information contained on our website is intended for educational and illustrative purpose only and does not constitute investment advice. Do not make any investment decisions or other decisions bases on the material presented, We cannot be held responsible for your trading results.